
2024 , Vol. 18 >Issue 04: 217 - 223
DOI: https://doi.org/10.3877/cma.j.issn.1674-0807.2024.04.005
BI-RADS 4类结节患者的乳腺癌风险预测模型
收稿日期: 2024-02-06
网络出版日期: 2024-08-20
基金资助
重庆市自然科学基金面上项目(CSTB2024NSCQ-MSX0331)
版权
Breast cancer risk prediction model for patients with BI-RADS 4 nodules
Received date: 2024-02-06
Online published: 2024-08-20
Copyright
利用乳腺成像报告和数据系统(BI-RADS)4类结节的临床和超声数据,开发和验证一种乳腺癌风险预测模型。
回顾性分析2017年1月至2018年12月在重庆医科大学附属第二医院就诊的338例患者的377个BI-RADS 4类乳腺结节临床资料。按照7∶3的比例随机将入组的BI-RADS 4类结节分为训练组和验证组。采用单因素Logistic回归和多因素Logistic逐步回归分析,最终确定一组乳腺癌风险独立预测因素的变量组合,创建列线图预测模型。利用受试者操作特征(ROC)曲线和校准曲线来评价列线图模型的性能。使用Hosmer-Lemeshow检验检测列线图模型的拟合度。采用临床决策曲线(DCA)评估该模型的临床预测效能。
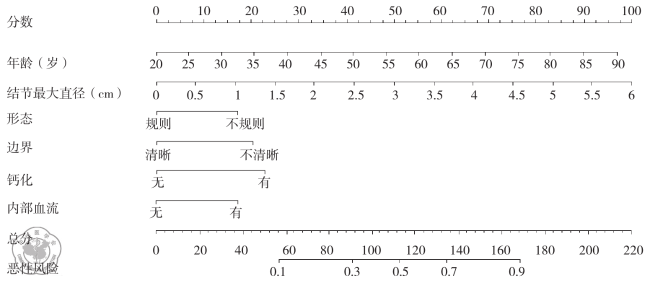
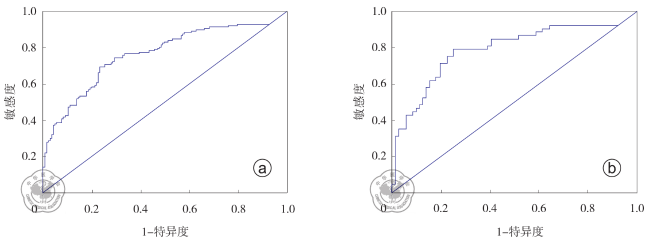
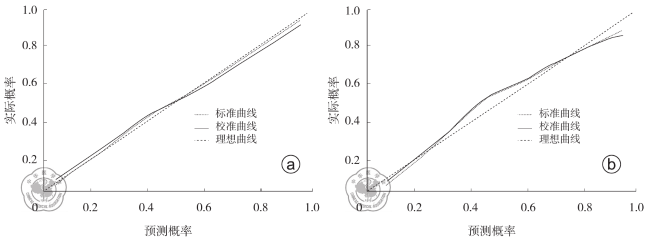
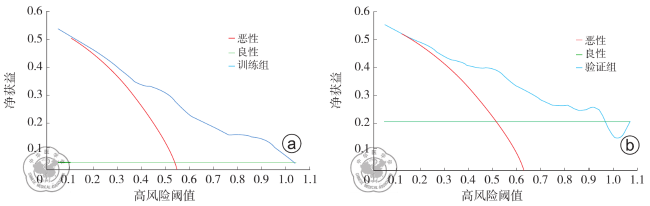
338例患者的377个BI-RADS 4类结节(202个良性和175个恶性),分为训练组263个,验证组114个。年龄(OR =1.06,95%CI:1.03~1.08,P<0.001)、边界(OR=2.22,95%CI:1.19~4.13,P=0.012)、形态(OR=1.96,95%CI:1.01~3.77,P=0.045)、钙化(OR =2.43,95%CI:1.35~4.36,P=0.003)、结节最大直径(OR =1.93,95%CI:1.38~2.69,P<0.001)和内部血流(OR=1.95,95%CI:1.08~3.51,P=0.026)是乳腺癌的独立预测因素。训练组和验证组通过列线图画出的ROC曲线下面积(AUC)分别为0.807(95%CI:0.755~0.858)和0.837(95%CI:0.764~0.910)。列线图预测模型具有良好拟合度(训练组:P=0.656;验证组:P=0.502);校准曲线表明列线图模型与实际观测结果有较好的一致性。DCA显示示当阈值概率大于0.1时,该模型预测净获益值较高。
基于临床和超声特征建立的列线图模型可以准确预测BI-RADS 4类结节乳腺癌风险,从而减少不必要手术活组织检查。
余晓青 , 高欣 , 罗文培 , 杨露 . BI-RADS 4类结节患者的乳腺癌风险预测模型[J]. 中华乳腺病杂志(电子版), 2024 , 18(04) : 217 -223 . DOI: 10.3877/cma.j.issn.1674-0807.2024.04.005
To develop and validate a breast cancer risk prediction model using clinical and ultrasound imaging data of the patients with the Breast Imaging-Reporting and Data System (BI-RADS) 4 nodules.
A retrospective analysis was conducted on the clinical data of 377 breast nodules of BI-RADS 4 from 338 patients who were treated in the Second Affiliated Hospital of Chongqing Medical University between January 2017 and December 2018. The nodules were randomly divided into the training group and the validation group at the ratio of 7∶3. Univariate and multivariate logistic step-wise regression analyses were used to identify a combination of variables that were independent predictive factors for breast cancer, and then nomogram prediction was constructed. The performance of the nomogram model was evaluated using the receiver operating characteristic (ROC) and calibration curves. The Hosmer-Lemeshow test was used to assess the goodness-of-fit of the nomogram model, and the clinical decision curve analysis (DCA) was used to evaluate the clinical predictive efficacy of the model.
The study included 377 BI-RADS 4 nodules (202 benign and 175 malignant) from 338 patients. All nodules were divided into two groups: training group (263 nodules) and validation group (114 groups). Age (OR=1.06, 95%CI: 1.03-1.08, P< 0.001), margins (OR=2.22, 95%CI: 1.19-4.13, P=0.012), shape (OR=1.96, 95%CI: 1.01-3.77, P=0.045), calcification (OR=2.43, 95%CI: 1.35-4.36, P=0.003), maximum diameter of the nodule (OR=1.93, 95%CI: 1.38-2.69, P<0.001) and internal blood flow (OR=1.95, 95%CI: 1.08-3.51, P=0.026) were independent predictive factors for breast cancer. The area under the ROC curve for the nomogram was 0.807 (95%CI: 0.755-0.858) in the training group and 0.837 (95%CI: 0.764-0.910) in the validation group. The nomogram prediction model showed a good fit (training group: P=0.656; validation group: P=0.502), and the calibration curve indicated a good consistency between the nomogram and the actual observation. The DCA showed higher net benefit for the model when the threshold probability was greater than 0.1.
The nomogram model based on clinical and ultrasound features can accurately predict the risk of breast cancer in the patients with BI-RADS 4 nodules, thereby reducing unnecessary surgical biopsies.
Key words: Breast neoplasms; Ultrasonography; Nomograms
 ±s表示,训练组和验证组的组间比较采用t检验。其余变量为计数资料,采用频数(构成比)表示,组间比较采用χ2检验。采用R软件(版本4.1.0;https://www.r-project.org/)进行单因素Logistic回归分析和多因素Logistic逐步回归分析,变量赋值表见表1。采用R软件的rms包构建列线图预测模型。利用受试者操作特征(receiver operating characteristic,ROC)曲线和校准曲线来评价列线图模型的性能。使用Hosmer-Lemeshow检验检测列线图模型的拟合度。采用临床决策曲线(decisoin curve analysis,DCA)评估该模型的临床预测效能。以P<0.050为差异具有统计学意义。
表1 变量赋值表 |
| 变量 | 变量类型 | 赋值 |
|---|---|---|
| 边界 | X1 | 清晰=1;不清晰=2 |
| 形态 | X2 | 规则=1;不规则=2 |
| 钙化 | X3 | 无=1;有=2 |
| 内部血流 | X4 | 无=1;有=2 |
| 绝经状态 | X5 | 否=1;是=2 |
| 方位 | X6 | 平行=1;非平行=2 |
| 偏侧性 | X7 | 左侧=1;右侧=2 |
| 后方回声 | X8 | 无=1;有=2;增强=3 |
| 原发部位 | X9 | 内上=1;内下=2;外上=3;外下=4;中央=5 |
| 内部回声 | X10 | 等回声=1;低回声=2;高回声=3;混合回声=4 |
| 结节性质 | Y | 良性=0;恶性=1 |
表2 训练组和验证组BI-RADS 4类结节的基线特征比较[个(%)] |
| 特征 | 训练组(263个) | 验证组(114个) | 检验值 | P值 |
|---|---|---|---|---|
年龄(岁, ±s) ±s) | 50.0±13.1 | 48.2±12.3 | t=1.228 | 0.220 |
| 边界 | ||||
| 清晰 | 121(46.0) | 49(43.0) | χ2=0.294 | 0.588 |
| 不清晰 | 142(54.0) | 65(57.0) | ||
| 形态 | ||||
| 规则 | 105(39.9) | 41(36.0) | χ2=0.525 | 0.469 |
| 不规则 | 158(60.1) | 73(64.0) | ||
| 钙化 | ||||
| 无 | 137(52.1) | 71(62.3) | χ2=3.339 | 0.068 |
| 有 | 126(47.9) | 43(37.7) | ||
结节最大直径(cm, ±s) ±s) | 1.80±0.97 | 1.93±1.34 | t=-0.951 | 0.343 |
| 内部血流 | ||||
| 无 | 144(54.8) | 54(47.4) | χ2=1.739 | 0.187 |
| 有 | 119(45.2) | 60(52.6) | ||
| 绝经状态 | ||||
| 否 | 154(58.6) | 68(59.6) | χ2=0.039 | 0.843 |
| 是 | 109(41.4) | 46(40.4) | ||
| 方位 | ||||
| 平行 | 242(92.0) | 107(93.9) | χ2=0.394 | 0.530 |
| 非平行 | 21(8.0) | 7(6.1) | ||
| 偏侧性 | ||||
| 左侧 | 136(51.7) | 65(57.0) | χ2=0.900 | 0.343 |
| 右侧 | 127(48.3) | 49(43.0) | ||
| 后方回声 | ||||
| 无声影 | 227(86.3) | 102(89.5) | χ2=2.428 | 0.297 |
| 有声影 | 26(9.9) | 11(9.6) | ||
| 增强 | 10(3.8) | 1(0.9) | ||
| 部位 | ||||
| 内上 | 75(28.5) | 21(18.4) | χ2=7.314 | 0.120 |
| 内下 | 15(5.7) | 11(9.6) | ||
| 外上 | 114(43.3) | 54(47.4) | ||
| 外下 | 46(17.6) | 18(15.8) | ||
| 中央 | 13(4.9) | 10(8.8) | ||
| 内部回声 | ||||
| 等回声 | 5(1.9) | 5(4.4) | χ2=4.774 | 0.189 |
| 低回声 | 239(90.9) | 99(86.8) | ||
| 高回声 | 7(2.7) | 1(0.9) | ||
| 混合回声 | 12(4.5) | 9(7.9) |
表3 训练组BI-RADS 4类结节乳腺癌发生风险的单因素Logistic回归分析 |
| 变量 | Wald值 | β值 | OR值 | 95%置信区间 | P值 |
|---|---|---|---|---|---|
| 年龄 | 25.30 | 0.06 | 1.06 | 1.03~1.08 | <0.001 |
| 边界 | 22.37 | 1.23 | 3.43 | 2.06~5.70 | <0.001 |
| 形态 | 15.29 | 1.03 | 2.79 | 1.67~4.66 | <0.001 |
| 钙化 | 10.43 | 0.81 | 2.26 | 1.38~3.70 | 0.001 |
| 结节最大直径 | 16.56 | 0.62 | 1.87 | 1.38~2.52 | <0.001 |
| 内部血流 | 12.74 | 0.91 | 2.48 | 1.51~4.08 | <0.001 |
| 绝经状态 | 12.67 | 0.92 | 2.50 | 1.51~4.14 | <0.001 |
| 方位 | 1.66 | 0.60 | 1.82 | 0.73~4.56 | 0.198 |
| 偏侧性 | 0.44 | 0.16 | 1.18 | 0.73~1.91 | 0.509 |
| 后方回声(与无声影比较) | |||||
| 有声影 | 1.21 | 0.46 | 1.58 | 0.70~3.60 | 0.272 |
| 增强 | 2.02 | 1.00 | 2.71 | 0.68~10.75 | 0.156 |
| 原发部位(与内上比较) | |||||
| 内下 | 0.01 | 0.05 | 1.06 | 0.35~3.21 | 0.925 |
| 外上 | 0.74 | 0.26 | 1.29 | 0.72~2.32 | 0.388 |
| 外下 | 0.001 | 0.01 | 1.01 | 0.48~2.12 | 0.973 |
| 中央 | 0.003 | 0.03 | 1.03 | 0.32~3.37 | 0.956 |
| 内部回声(与等回声比较) | |||||
| 低回声 | 0.001 | 15.56 | 650.87 | 无a | 0.981 |
| 高回声 | 0.001 | 14.65 | 650.87 | 无a | 0.982 |
| 混合回声 | 0.001 | 15.57 | 650.87 | 无a | 0.981 |
注:a样本量太小导致估计值不稳定,无法给出一个有意义的上限;OR为比值比 |
表4 训练组BI-RADS 4类结节乳腺癌发生风险的多因素Logistic逐步回归分析 |
| 变量 | Wald值 | β值 | OR值 | 95%置信区间 | P值 |
|---|---|---|---|---|---|
| 年龄 | 25.00 | 0.05 | 1.06 | 1.03~1.08 | <0.001 |
| 边界 | 6.30 | 0.80 | 2.22 | 1.19~4.13 | 0.012 |
| 形态 | 4.00 | 0.67 | 1.96 | 1.01~3.77 | 0.045 |
| 钙化 | 8.82 | 0.89 | 2.43 | 1.35~4.36 | 0.003 |
| 结节最大直径 | 14.98 | 0.66 | 1.93 | 1.38~2.69 | <0.001 |
| 内部血流 | 4.93 | 0.67 | 1.95 | 1.08~3.51 | 0.026 |
注:OR为比值比 |
| [1] |
|
| [2] |
|
| [3] |
|
| [4] |
|
| [5] |
|
| [6] |
|
| [7] |
|
| [8] |
|
| [9] |
|
| [10] |
|
| [11] |
|
| [12] |
|
| [13] |
|
| [14] |
|
| [15] |
|
| [16] |
|
| [17] |
|
| [18] |
|
| [19] |
|
/
| 〈 |
|
〉 |